Aero Helmet Wind Tunnel Testing
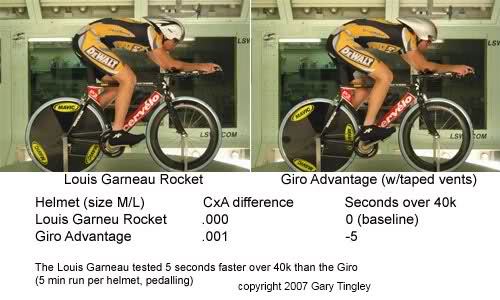
We tested several aero helmets. Not surprisingly, we found that every athlete responds differently to aero equipment. One common theme is that there were “good” and “bad” helmets, regardless of the rider that was testing them. Results for the Louis Garneau and Giro are shown above. Surprisingly, the old Troxel titanium dimpled helmet also tested well.
- Lower profile helmets are more aerodynamic
- Shape matters, the helmet should transition to the rider’s back as seamlessly as possible
- Visors were not tested – may or may not have an impact
- “Filled” tails were not tested – again, may have an impact especially for tails that sit up off the back
We also tested three hand positions, the “pointer”, “pistol”, and “superman”. What was apparent is that there were little discernible differences in the results, with the best result from the original baseline “pointer” position. This is likely due to the smaller frontal area that the position provides, as compared to the other two positions.
- All three hand positions are fairly close in terms of aerodynamics
- Gloves were not tested, however if gloves were to be worn, a low profile set such as the aero versions from Castelli or Nike should be considered
- Smaller hand profiles are important
How to Calculate Cycling Aerodynamic Drag Using a Power Meter
Originally seen at http://cyclingillustrated.com/how-to-calculate-cycling-aerodynamic-drag-using-a-power-meter/
Don’t have access to a wind tunnel or velodrome? No problem. You can test your own time trial position or gear/helmet changes using the following instructions. All you need is a calm day, an uninterrupted flat course, a power meter, and the following instructions. Using details in the screenshot image above, and the calculator provided by Analytic Cycling, you can estimate the power required to complete a time trial for any specific time. In the example screen shot, I used a 20k time trial at sea level on a calm day. An alternative method for estimating aerodynamic drag can be found by measuring anthropometric data.

The calculators and links required are located at:
- http://www.analyticcycling.com/ForcesPower_Page.html
- http://www.unitjuggler.com/speed-conversion.html (convert mph or kph to m/s)
- http://www.wunderground.com/weatherstation/index.asp (wind/air pressure)
For this example, rolling resistance for the course is in the numbers in the screen shot. For purposes of the estimate, use the defaults in the image for pedal range, wind, drag, air pressure, Crr, and rise.
Then plug in your crank length and average cadence.
Also plug in the speed in meters per second, then change the frontal area up or down until the power matches the average from the race, with the caveat of the time lost to inertia at the start (add 5 seconds to the time).
An example for a hypothetical “aero-tuned” cyclist competing at the San Diego Time Trial at Fiesta Island, which is a point to point 3-lap 20k course:
- .44 frontal area [.440m^2 x 0.5 = .220m^2 of CdA]
- 83kg rider and bike Slope – 0.0015, crr 0.004, 12.69 m/s – 332w – 26:15 for 20k
- + 5 secs first lap = 26:20
- .44 frontal area [.440m^2 x 0.5 = .220m^2 of CdA]
- 83kg rider and bike Slope – 0.0015, crr 0.004, 12.82 m/s – 341w – 26:00 for 20k
- + 5 secs first lap = 26:05
Once you know your CdA, you can calculate your Functional Threshold Power (FTP) as it relates to your aerodynamic drag (CdA) in terms of W/m^2. With this number you can then compare your aerodynamic drag/power ratio to other riders.